From Purchase Price to Payback: Building a Total Cost Case for Rugged Device Investments
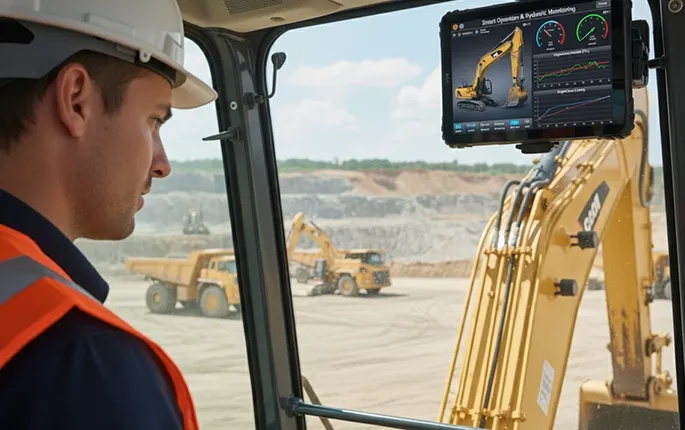
Photo: enterprise field worker using rugged tablet on construction site with financial data overlay, via www.topicon.hk
When a procurement manager at a mid-sized construction firm sees a rugged tablet priced at $1,800 alongside a consumer-grade alternative at $1,100, the instinct is understandable: the cheaper device looks like the responsible choice. Budgets are tight, and a $700 gap across a fleet of 150 devices represents more than $100,000 in apparent savings. That logic, however, tends to collapse quickly once the devices reach the job site.
The true financial performance of any mobile device deployed in field operations is not determined at the point of sale. It is determined across a three-to-five-year operational window, shaped by repair frequency, unplanned downtime, IT labor, and the cascading productivity losses that follow every device failure. Enterprise decision-makers who build their procurement case around acquisition cost alone are, in effect, measuring only the first chapter of a much longer story.
Why Sticker Price Is the Wrong Metric
Total cost of ownership (TCO) analysis exists precisely because upfront cost is an incomplete signal. In rugged device deployments, the gap between acquisition cost and actual operational cost is wider than in almost any other enterprise hardware category. This is because field environments — construction sites, distribution warehouses, utility corridors, and manufacturing floors — subject devices to conditions that consumer hardware was never engineered to survive.
Drop incidents alone account for a significant share of device failures in field operations. Industry service data consistently indicates that consumer smartphones and tablets deployed in industrial settings experience failure rates between 35% and 50% within the first 18 months. Each failure triggers a chain of costs: the repair or replacement cost itself, the IT time required to manage the incident, the data recovery effort if the device was not properly backed up, and the productivity loss incurred while the worker operates without a functioning device or waits for a replacement to be provisioned.
When these costs are aggregated across a fleet and projected over a standard three-year refresh cycle, the financial picture shifts dramatically.
Building the TCO Model: Key Variables
A rigorous TCO model for rugged versus consumer device comparison should account for the following cost categories:
Device acquisition and accessories. Include the base device price, protective cases (often required for consumer devices in the field), and any peripherals such as barcode scanners or vehicle mounts. Rugged devices frequently eliminate the need for aftermarket protection, which narrows the apparent price gap.
Repair and replacement costs. Estimate annual failure rates based on your operational environment and apply average repair costs. For consumer devices, screen replacements alone can run $150 to $400 per incident. Rugged device repair rates in comparable environments typically run 60% to 75% lower.
IT labor and device management overhead. Every repair event consumes IT staff time — diagnostics, shipping, reimaging, and redeployment. At a fully burdened labor rate of $45 to $75 per hour, a single device failure can represent $200 to $400 in IT labor before a replacement is back in the field.
Downtime and productivity losses. This is where TCO models most frequently underestimate true costs. A field technician or delivery driver without a functioning device is not simply inconvenienced — they may be unable to complete work orders, access routing data, or capture compliance documentation. Conservatively valuing field worker productivity at $35 to $60 per hour, even two hours of downtime per incident adds meaningful cost at scale.
Refresh cycle length. Rugged devices are engineered for longer operational lifespans. A consumer device may realistically survive 18 to 24 months in a demanding field environment before requiring replacement. A purpose-built rugged device in the same environment commonly delivers 48 to 60 months of service. Extending the refresh cycle by even 12 months across a fleet of 100 devices eliminates an entire procurement cycle — a significant capital deferral.
A Worked Example: Logistics Fleet of 100 Devices
Consider a regional logistics operator running a fleet of 100 mobile devices across its delivery and warehouse operations. The consumer device option costs $1,100 per unit; the rugged alternative is priced at $1,550.
Acquisition cost difference: $45,000 in favor of the consumer device.
Over a three-year period, applying conservative industry failure rates:
- Consumer device fleet: 42 failure events per year × 3 years = 126 incidents. At an average fully-loaded cost of $650 per incident (repair, IT labor, productivity loss), total incident cost reaches $81,900.
- Rugged device fleet: 11 failure events per year × 3 years = 33 incidents. At $580 per incident (lower repair cost, similar labor and downtime), total incident cost reaches $19,140.
The incident cost difference alone — $62,760 — more than offsets the $45,000 acquisition premium. Add in the productivity gains from fewer disruptions and the potential deferral of a full refresh cycle, and the rugged investment delivers a net financial advantage of $80,000 to $110,000 over the analysis period.
That translates to an effective cost reduction of roughly 65% on operational expenses, despite a 41% higher purchase price.
Case Perspectives from the Field
These dynamics play out consistently across industries. In construction, project managers report that device failures during critical inspection or documentation windows create rework costs that dwarf the device replacement cost itself. A missed photo documentation requirement or a corrupted as-built record can generate compliance exposure or contract disputes that run into the tens of thousands of dollars.
In field service — HVAC, utilities, telecommunications infrastructure — technicians unable to access work order systems or parts databases in real time experience extended job durations. When service contracts carry performance penalties for missed completion windows, device reliability becomes a direct revenue protection issue.
In distribution and logistics, route management and proof-of-delivery functions are mission-critical. A single device failure that disrupts delivery confirmation for a high-value shipment can trigger contractual disputes or customer attrition costs that far exceed any hardware savings.
Structuring the Internal Business Case
For procurement and IT leaders preparing to present a rugged device investment to finance leadership, the framing matters as much as the numbers. Lead with a three-year TCO comparison rather than a unit price comparison. Quantify downtime costs using your organization's actual labor rates and productivity benchmarks. Document historical failure rates from your current device fleet — most enterprise MDM platforms capture this data.
If historical data is limited, conservative industry benchmarks are defensible and widely available from device manufacturers, third-party analysts, and industry associations. The goal is not to manufacture a favorable outcome but to ensure that the full financial picture is visible to decision-makers who would otherwise optimize for the wrong variable.
The rugged device premium, viewed in isolation, looks like a cost. Viewed across a realistic operational horizon, it almost invariably looks like an investment — one with a measurable and often compelling return.