What Rugged Device Failures Actually Cost Your Operation: A Framework for Quantifying Field Downtime
Most finance teams evaluate hardware purchases by comparing sticker prices. A rugged handheld costs more than a consumer-grade smartphone, and that gap is visible, tangible, and easy to challenge in a budget meeting. What rarely appears on the same spreadsheet is the compounding financial damage that follows a device failure in the field—lost labor hours, delayed service delivery, emergency procurement costs, and, in regulated industries, potential liability exposure.
Enterprise leaders who have lived through a fleet-wide failure event understand this calculus intuitively. The challenge is translating that experience into numbers that resonate with finance stakeholders who were not on the ground when things went wrong. This article offers a structured framework for doing exactly that.
Why Standard Downtime Metrics Fall Short
IT organizations typically measure device downtime in terms of mean time to repair (MTTR) and mean time between failures (MTBF). These are useful operational benchmarks, but they capture only a fraction of the actual cost picture. A device that is offline for four hours carries a very different financial weight depending on what that device was doing, where it was located, and what cascading effects its absence triggered.
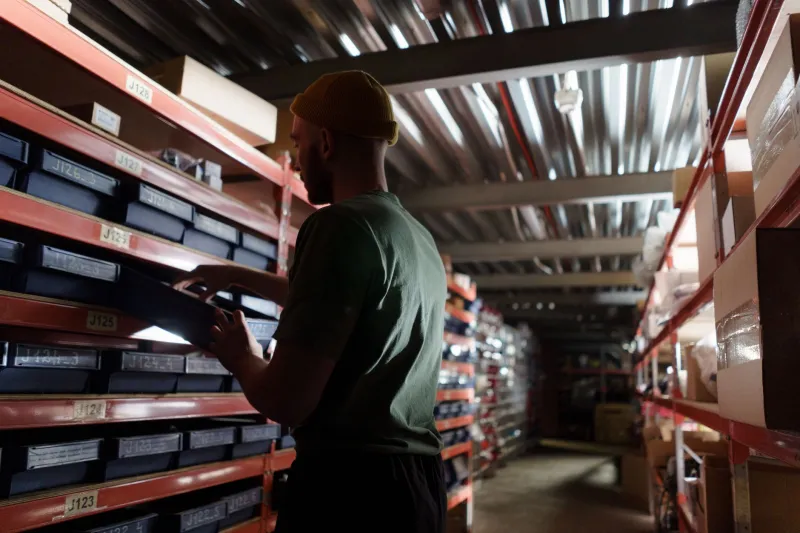
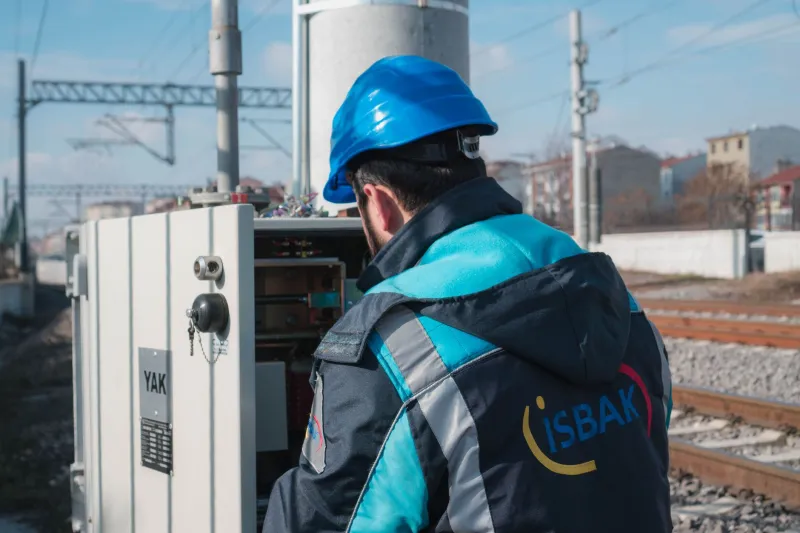
Consider the difference between a warehouse scanner that goes down during a slow shift and a utility technician's handheld that fails mid-inspection on a remote transmission corridor. In the first case, a supervisor may reroute work without significant disruption. In the second, the technician may be unable to log inspection data, complete a compliance form, or communicate with dispatch—triggering a full recall to base, a rescheduled site visit, and a potential regulatory gap.
The standard MTTR clock does not capture the rescheduled visit, the compliance gap, or the fuel and labor cost of the return trip.
Building the Cost Framework: Four Categories of Impact
A comprehensive downtime cost model for rugged devices should account for four distinct expense categories.
1. Direct Labor Productivity Loss
This is the most straightforward component. When a device fails, the field worker assigned to it either stops productive work entirely or shifts to a slower, manual workaround. To quantify this:
- Multiply the worker's fully loaded hourly cost (wages plus benefits plus overhead) by the duration of the downtime event.
- Add any overtime costs incurred to recover the lost output.
- If multiple workers are affected—for example, a crew whose workflow depends on a single connected device—multiply accordingly.
In logistics operations, a single handheld scanner failure on a loading dock can idle two to four workers simultaneously if their scan-dependent workflow cannot proceed. At average fully loaded labor rates for warehouse personnel in the US, a two-hour event involving three workers can represent $300 to $600 in direct productivity loss before any other costs are considered.
2. Service Delivery Delays and Revenue Impact
For field service organizations, delayed work orders translate directly to delayed billing. In construction and utilities, project schedule slippage carries contractual consequences. In last-mile delivery, missed time windows generate customer penalties and erode retention.
To estimate this component:
- Identify the average revenue value of a completed work order or delivery.
- Estimate the percentage of device failure events that result in a delayed or missed completion.
- Multiply across your annual failure rate.
A mid-size utility with 200 field technicians experiencing an average of 1.5 device failure events per device per year—at a conservative estimate of one delayed work order per event valued at $400—faces roughly $120,000 in annual revenue deferral from device failures alone.
3. Emergency Replacement and Logistics Costs
When a device fails without a managed spare pool in place, organizations often resort to expedited procurement, overnight shipping, or temporary deployment of consumer-grade substitutes. Each of these responses carries a cost premium that far exceeds what a planned refresh cycle would have required.
Expedited hardware sourcing can add 20 to 40 percent to device unit costs. Consumer-grade substitutes introduce compatibility issues, security risks, and additional configuration labor. And the IT time required to process an emergency replacement—imaging, enrolling, and deploying a device outside of a standard cycle—typically runs two to four hours per unit.
4. Liability and Compliance Exposure
In regulated industries, a device failure that interrupts a required inspection, documentation process, or safety check can create compliance exposure that dwarfs all other cost categories. OSHA-regulated construction sites, utility operations subject to NERC CIP standards, and healthcare field services operating under HIPAA all carry specific documentation requirements that depend on functioning field devices.
While liability costs are difficult to predict with precision, enterprises should include a risk-adjusted estimate in their downtime model. Even a modest probability of a regulatory finding—multiplied by the potential penalty range—can shift the financial case for rugged hardware dramatically.
Industry Scenarios: Putting the Framework to Work
Utilities: A regional electric utility with 150 field technicians using non-rugged tablets in substation inspection roles experienced a 12 percent annual device failure rate. Applying the four-category framework revealed annualized downtime costs exceeding $280,000—a figure that justified a full fleet refresh to ruggedized hardware with a projected payback period under 18 months.
Construction: A commercial general contractor operating across 40 active job sites found that device failures on superintendent tablets were contributing to an average of two days of schedule delay per project per year, due to interrupted RFI documentation workflows. At an average project value of $8 million and a 0.1 percent daily liquidated damages clause, that delay exposure represented $16,000 per project.
Logistics: A regional parcel carrier discovered that handheld scanner failures during peak delivery windows were generating an average of 14 missed delivery attempts per event. At a re-delivery cost of $4.50 per attempt and a failure event frequency of three per week across its fleet, the annual cost totaled more than $9,800—not including customer satisfaction impacts.
Presenting the Case to Finance
The framework above is most effective when presented not as a worst-case scenario but as a probability-weighted annual cost estimate. Finance stakeholders respond to models that acknowledge uncertainty while grounding projections in documented operational data.
Recommended presentation structure:
- Baseline your current failure rate using device management platform data or IT service desk records.
- Apply the four-category model to your top three failure scenarios.
- Compare the annualized cost estimate against the incremental cost of ruggedized alternatives.
- Present the payback period and five-year total cost of ownership comparison side by side.
The goal is not to manufacture alarm but to replace an incomplete cost picture with a complete one. When finance teams see the full ledger, the investment case for purpose-built rugged hardware becomes considerably easier to defend.
The Measurement Discipline That Makes the Difference
Organizations that maintain rigorous device failure logs, track downstream operational impacts, and document emergency procurement costs are positioned to run this analysis with high confidence. Those that do not have that data infrastructure should treat this framework as a prompt to begin building it.
The cost of rugged device downtime is not theoretical. It is occurring in measurable increments across every field operation that has not accounted for it. The enterprises that quantify it first are the ones best positioned to eliminate it.